한식에 대한 다채로운 이야기를 전하는 온라인 매거진
What Are the Keys to Successful Startups and Global Expansion for the Hansik Industry?
Infographic News
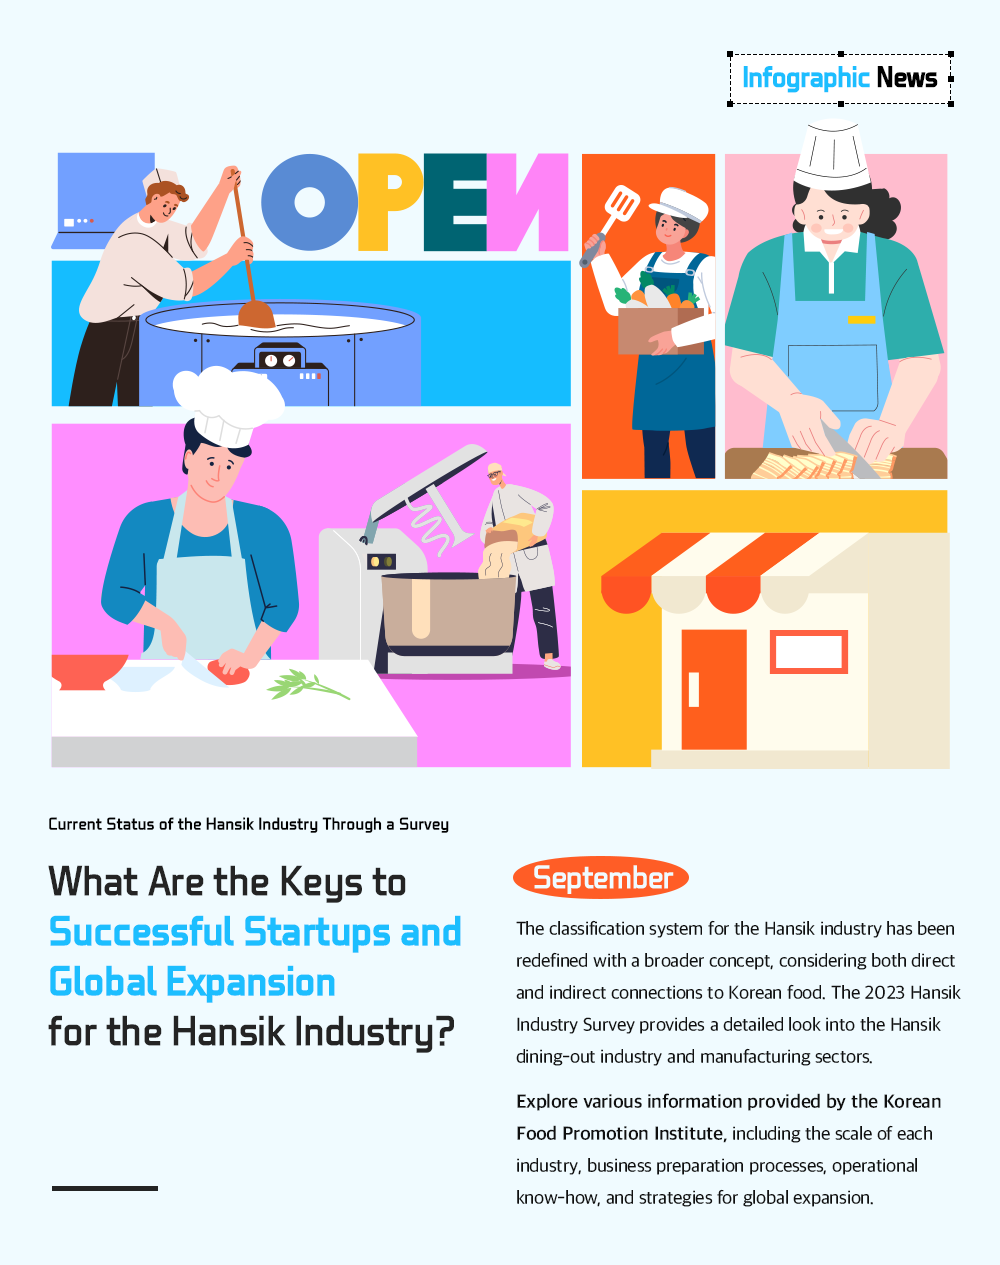
The global popularity of K-Food has made the domestic restaurant and food manufacturing industries more active. In response, there is a growing demand for policy changes to promote the Korean food industry. To address this, the Korean Food Promotion Institute conducted the '2023 Hansik Industry Survey' to assess the overall status of the restaurant and manufacturing sectors. The survey results are presented in an infographic for those considering starting a Hansik business or expanding overseas.
Q. What is the background and purpose of the survey?
There is a growing call for Hansik policies, which have traditionally focused on the restaurant industry, to shift towards a comprehensive approach to industry growth and development. In response, the Korean Food Promotion Institute conducted the Hansik Industry Survey to assess the overall state of the industry, including its scale, and to gather foundational data for formulating comprehensive growth and development policies.
Q. What was the survey period and target?
The Hansik Industry Survey is conducted annually, and the 2023 survey took place from September to November 2023. The survey targeted industries and businesses included in the core Hansik industry, selecting a sample of 1,500 Korean restaurants and pub businesses and 1,000 Korean food manufacturing businesses.
*There are a total of 42 standard industry classifications (at the detailed level) related to the core Hansik industry, and the number of Hansik businesses is estimated to be 512,979.
Q. What are the survey items?
For Korean food restaurants and Korean pub businesses, the survey items include business information, owner status, sales and operating expenses, employment and human resource management, startup conditions, business operation, ingredient usage, and support-related status. For Korean food & beverage manufacturing, the survey items include business information, sales and operating expenses, employment and human resource management, export-related activities, raw material usage, and research and development status.

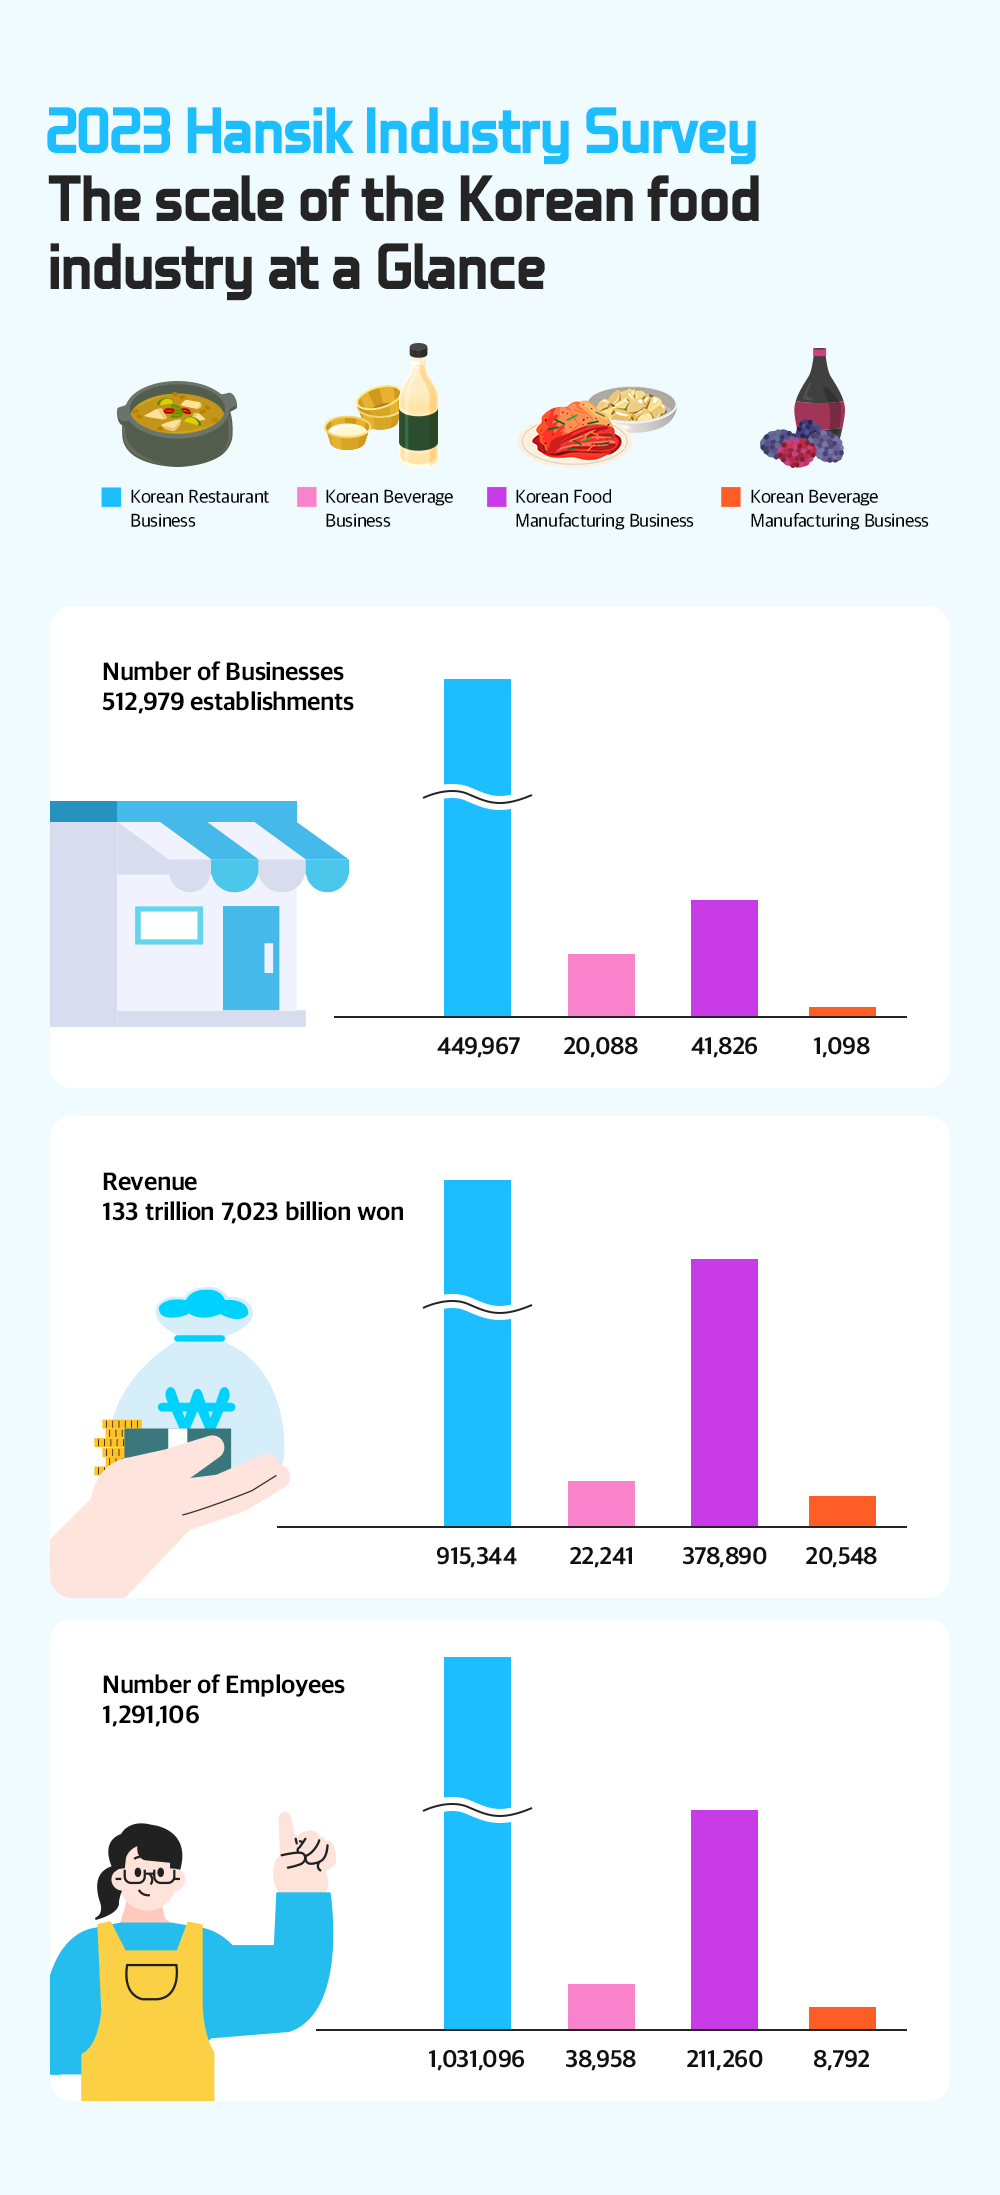
An Overview of the Hansik Industry Scale
Considering the evolving patterns of Hansik consumption, the Korean Food Promotion Institute has defined four industries as ‘Core Hansik Industries’: Korean Restaurant Business, Korean Pub Business, Korean Food Manufacturing Business, and Korean Beverage Manufacturing Business.
The survey of core Hansik industries, examining business size, sales, and number of employees, revealed that the largest industry by business size is the Korean restaurant business, followed by Korean food manufacturing, Korean pubs, and Korean beverage manufacturing business.
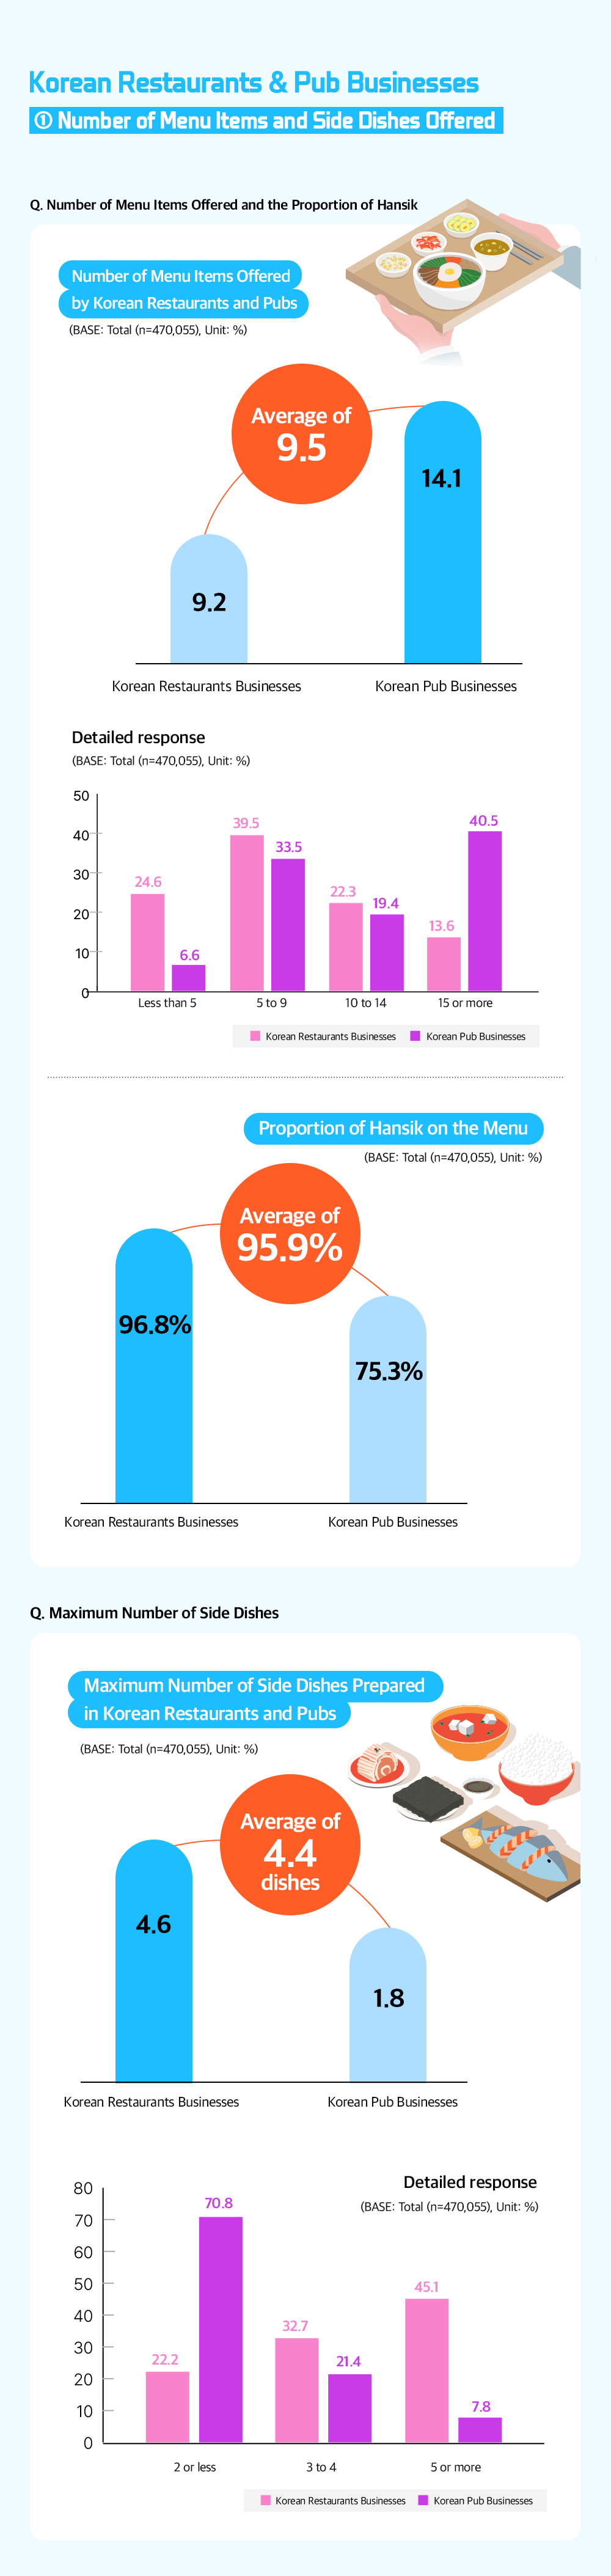
Korean Restaurants & Pub Businesses① Number of Menu Items and Side Dishes Offered
A detailed look at the operational status of core industries reveals that, in the restaurant and pub business, the average number of menu items offered is 9.5. Of these, Korean dishes make up an average of 95.9%. Korean restaurants typically offer fewer than 5 to 10 menu items, while Korean pubs often provide 15 or more. The average number of side dishes prepared is 4.4, with Korean restaurants generally offering more side dishes than pubs.
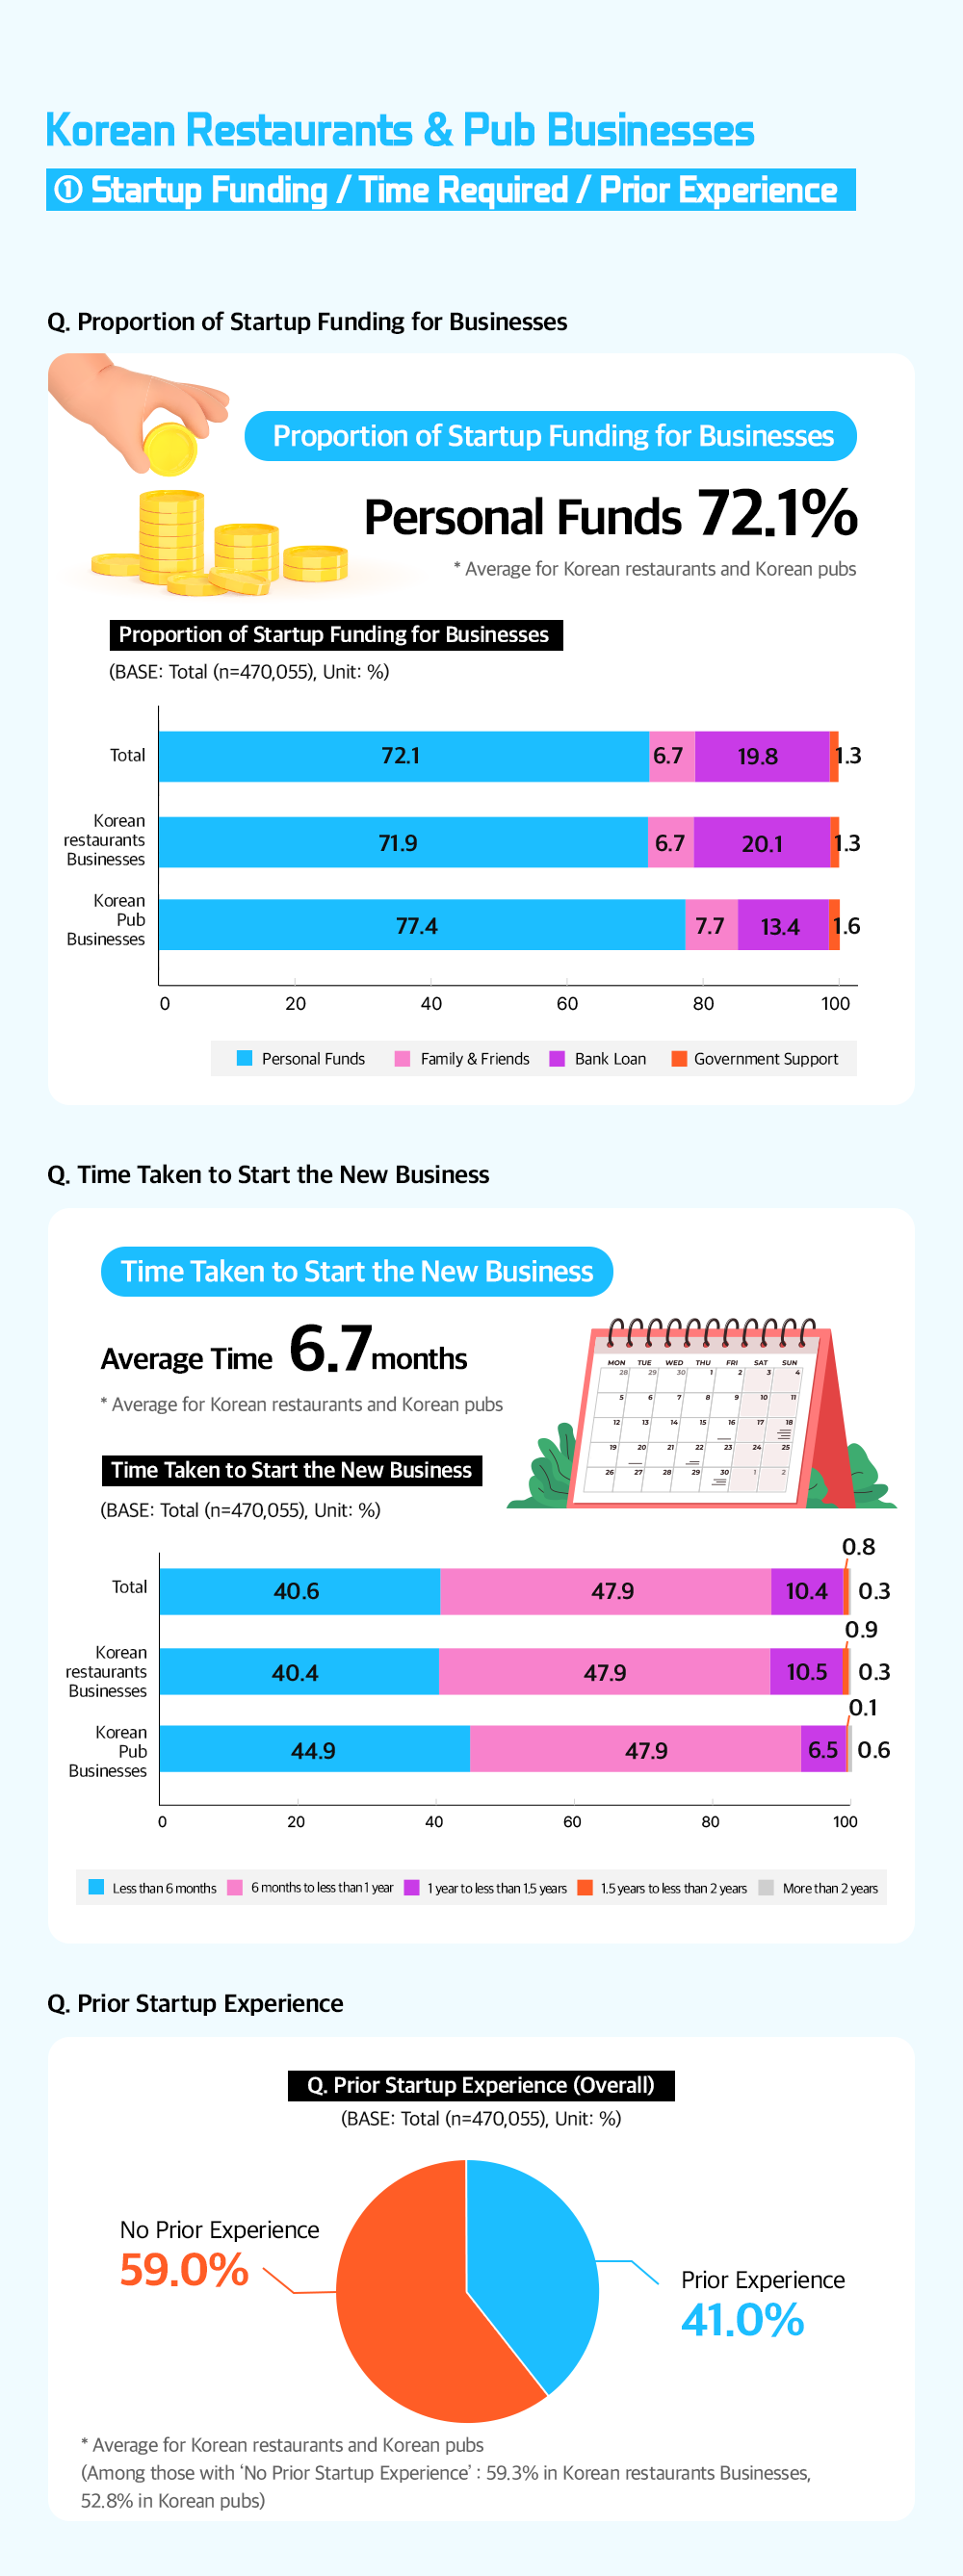
Korean Restaurants & Pub Businesses② Startup Funding/Time Required/Prior Experience
The majority of startup funding was covered by personal funds (72.1%), followed by loans from financial institutions (19.8%), family/friends (6.7%), and government support (1.3%). The average time required to start a business was about 6.7 months, with more than half of the businesses reporting no prior startup experience. This indicates that new talent is entering the Hansik industry.
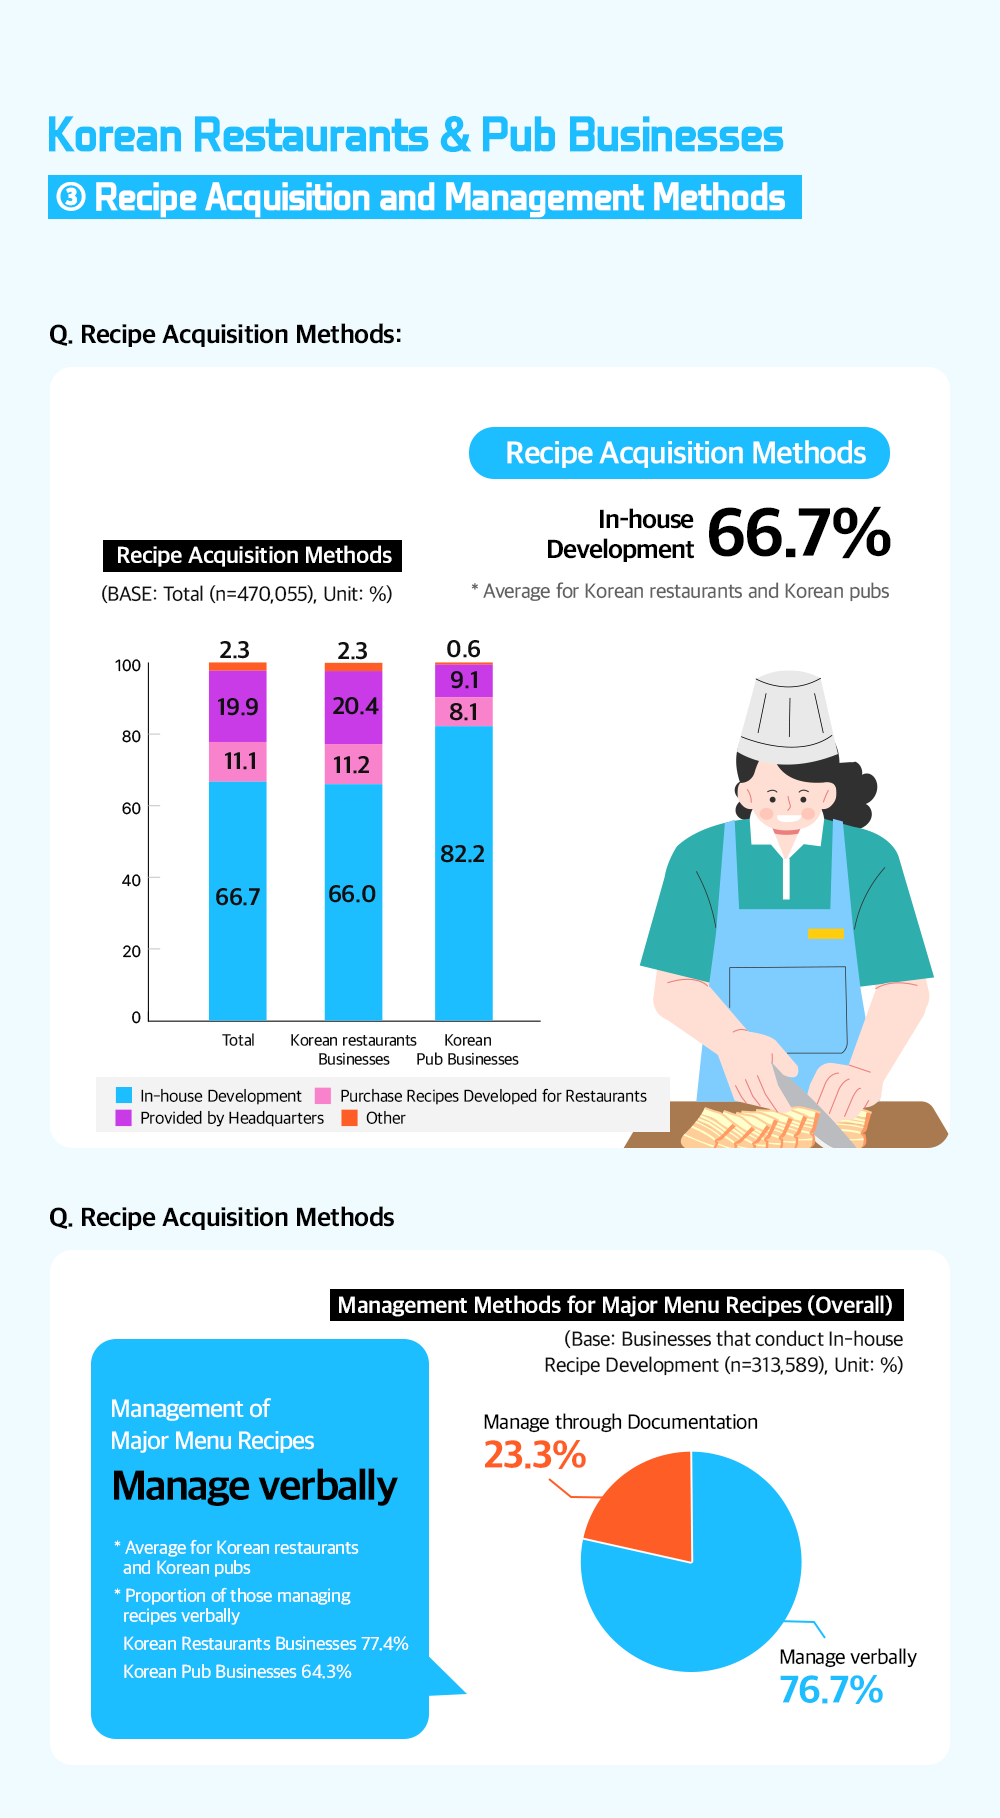
Korean Restaurants & Pub Businesses③ Methods of Acquiring and Managing Recipes
In the Korean restaurant businesses, the most common method for acquiring recipes is direct development (66.7%), followed by recipes provided by the headquarters (19.9%) and purchasing recipes developed for restaurants (11.1%). Notably, more than three out of four Korean pubs (82.2%) develop their own recipes. Among businesses that develop their own recipes, 76.7% manage them verbally, while only 23.3% manage their recipes through documentation.
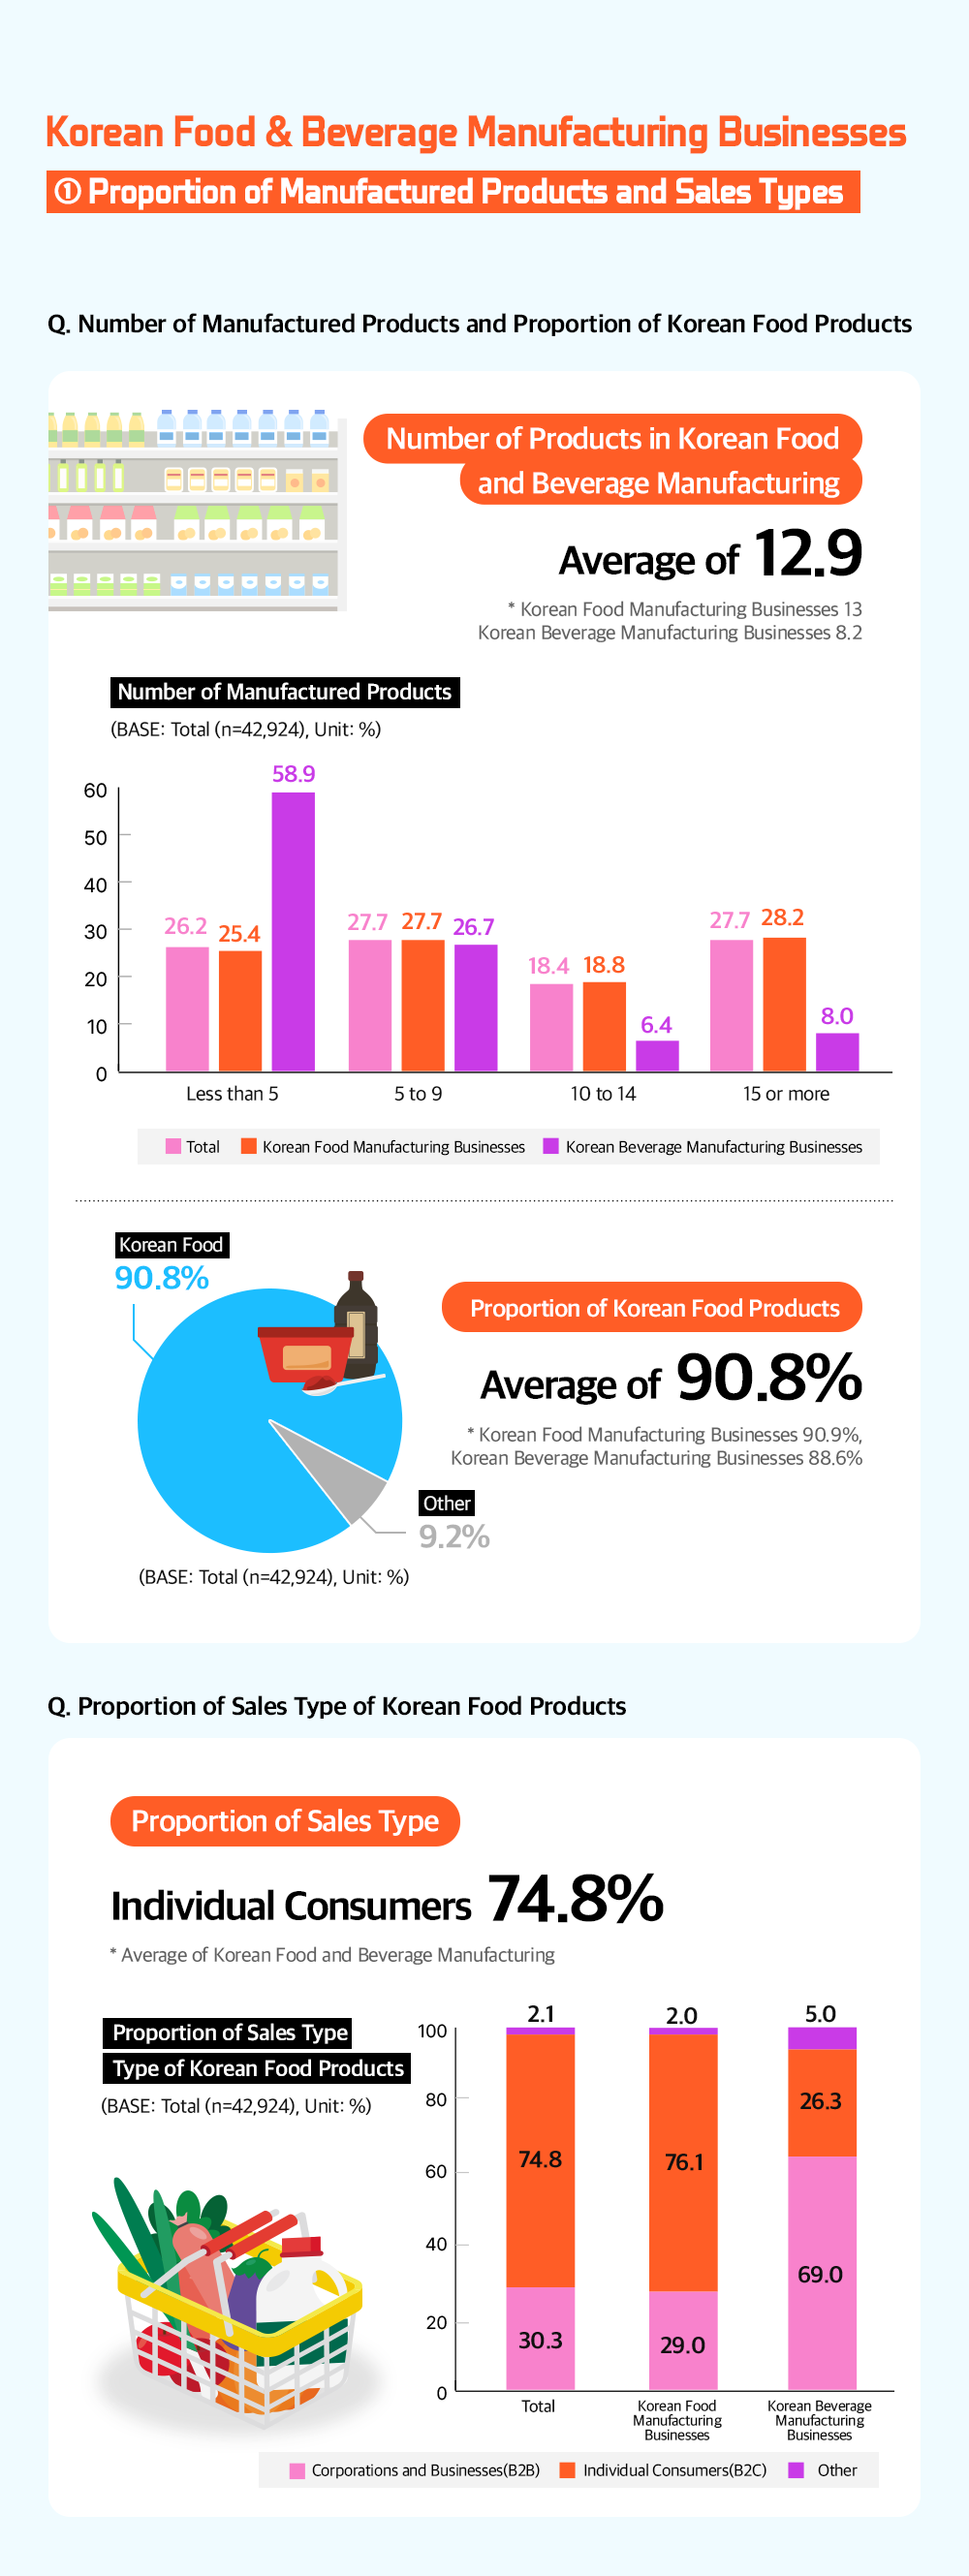
Korean Food & Beverage Manufacturing Businesses① Proportion of Manufactured Products and Sales Type
In the Korean food and beverage manufacturing businesses, an average of 12.9 products are produced, with over 90% being Korean products. Among Korean food manufacturers, 28.2% produce 15 or more products, the highest rate, while in Korean beverage manufacturing, over half (58.9%) of the businesses produce fewer than 5 products, indicating a difference.
In terms of sales, individual consumers account for the largest share (74.8%), followed by corporations and businesses (30.3%), and other categories (2.1%). When examined by industry, Korean food manufacturing businesses primarily target individual consumers (76.1%), whereas Korean beverage manufacturers mostly target corporations and businesses (69.0%).
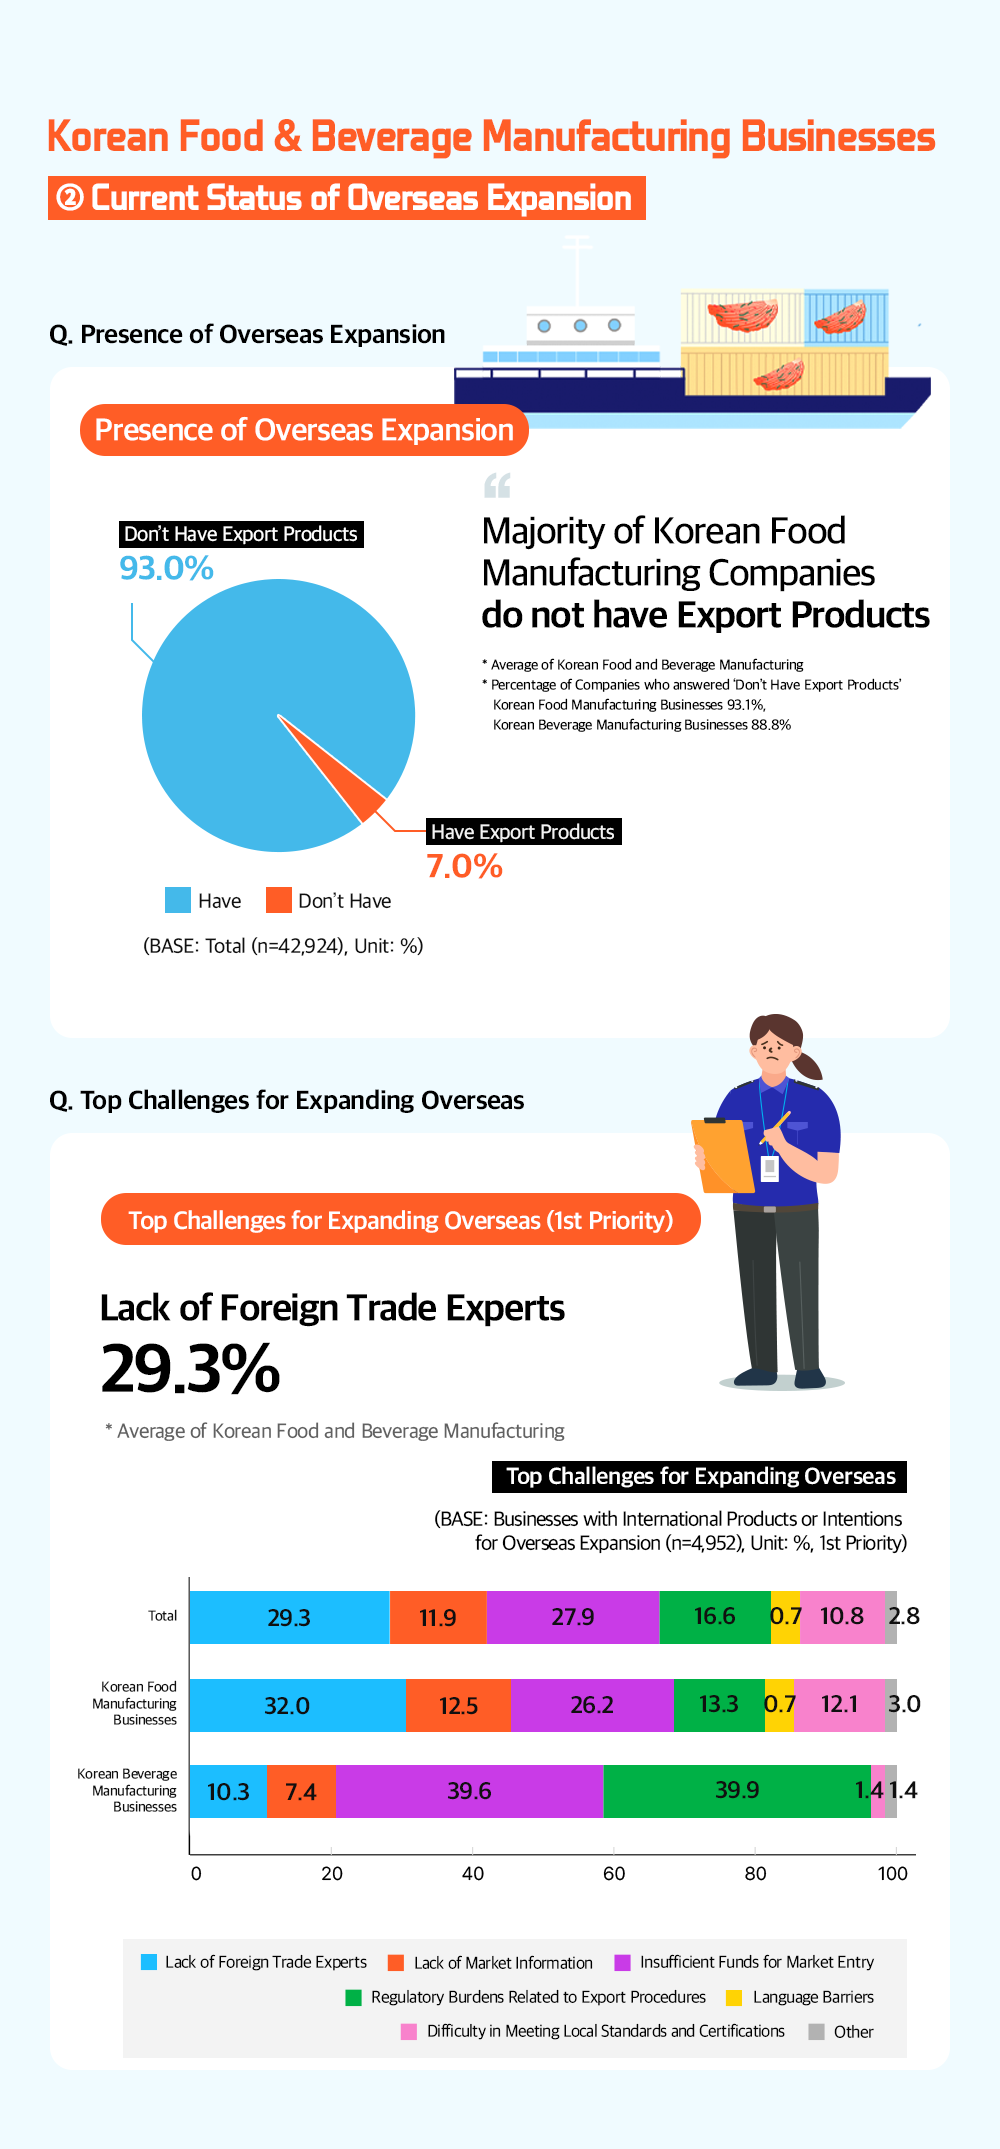
Korean Food & Beverage Manufacturing Businesses② Current Status of Overseas Expansion
The survey on overseas expansion revealed that the majority of companies (93.0%) do not have presence in international markets. Among the businesses with existing overseas products or plans for future international expansion, key challenges identified include a shortage of trade experts (29.3%), lack of necessary funds for entering foreign markets (27.9%), and burdensome export-related procedural regulations (16.6%).
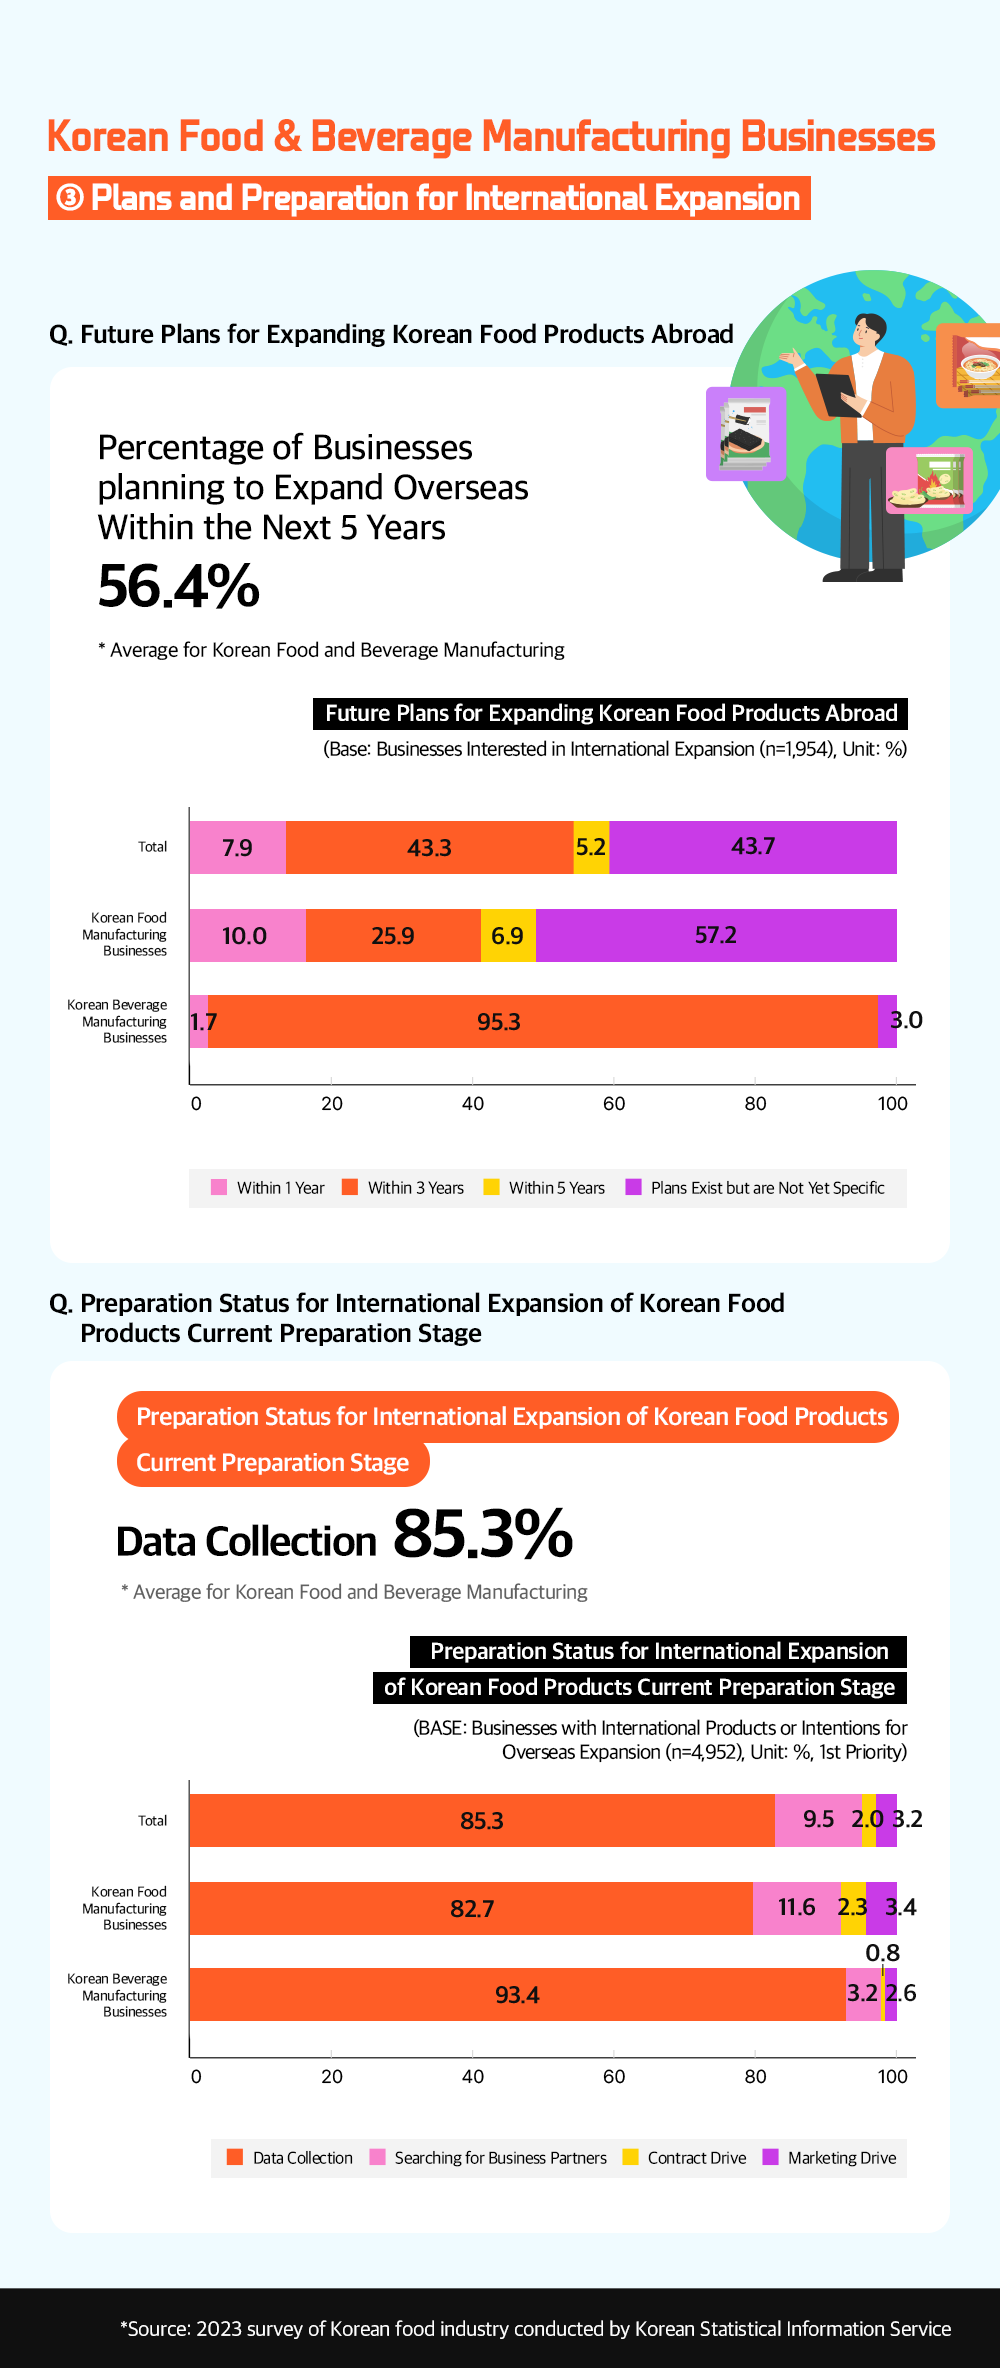
Korean Food & Beverage Manufacturing Businesses③ Plans and Preparation for Overseas Expansion
Among businesses interested in international expansion, over half(56.4%) have plans to enter foreign markets with Korean products within the next 1 to 5 years. The remaining businesses (43.7%) have plans but have not yet developed specific details. Notably, a majority of Korean beverage manufacturers (95.3%) have plans to expand internationally within 3 years. The most common current stage of preparation for overseas expansion is data collection (85.3%).
As both the restaurant and manufacturing sectors of the Hansik industry are experiencing growth, thorough market research, systematic business preparation, and strategic planning for international expansion are expected to be crucial for continued growth and successful international market entry.